
This blog is based on a discussion between Labbit and Astrix about how graph architecture can help GMP laboratories connect their data, improve traceability, and support AI applications. Check out the conversation here.
How laboratory data is structured in a GMP lab is just as important as how it is generated, shaping how quickly teams can trace a result’s history, investigate unexpected findings, and access the evidence behind batch release decisions.
Most LIMS have historically relied on relational databases, which organize data in tables and use SQL (Structured Query Language) to retrieve it. Bringing records together into a complete history is possible in relational databases, but the necessary relationships must be defined during implementation as a separate configuration activity. Without that upfront planning, connecting records often requires custom queries and reports, which can slow analysis and make data harder to reuse across workflows.
LIMS built on graph databases offer a different approach by storing relationships alongside the data, linking results to samples, methods, instruments, and testing activities. This provides a richer foundation for teams and AI tools to access, analyze, and use laboratory data.
How graph architecture works in LIMS
In a graph-based LIMS, information is represented as nodes and their relationships.
- A node might represent a sample, lab tech, instrument, or activity.
- Relationships describe how they connect: a lab tech performs a task, the task produces a plate, and the plate goes onto an autosampler.
This structure allows LIMS to follow paths across related records, including when a workflow spans multiple samples, activities, instruments, and exceptions.
Why graph architecture matters in GMP labs
For a GMP laboratory, a “result” isn’t simply a single datapoint. The full record includes the conditions and activities that produced it, including:
- The method used
- Whether the instrument was properly calibrated at the time of testing
- Whether this was an original test or a retest
- Whether the result informed a batch release decision
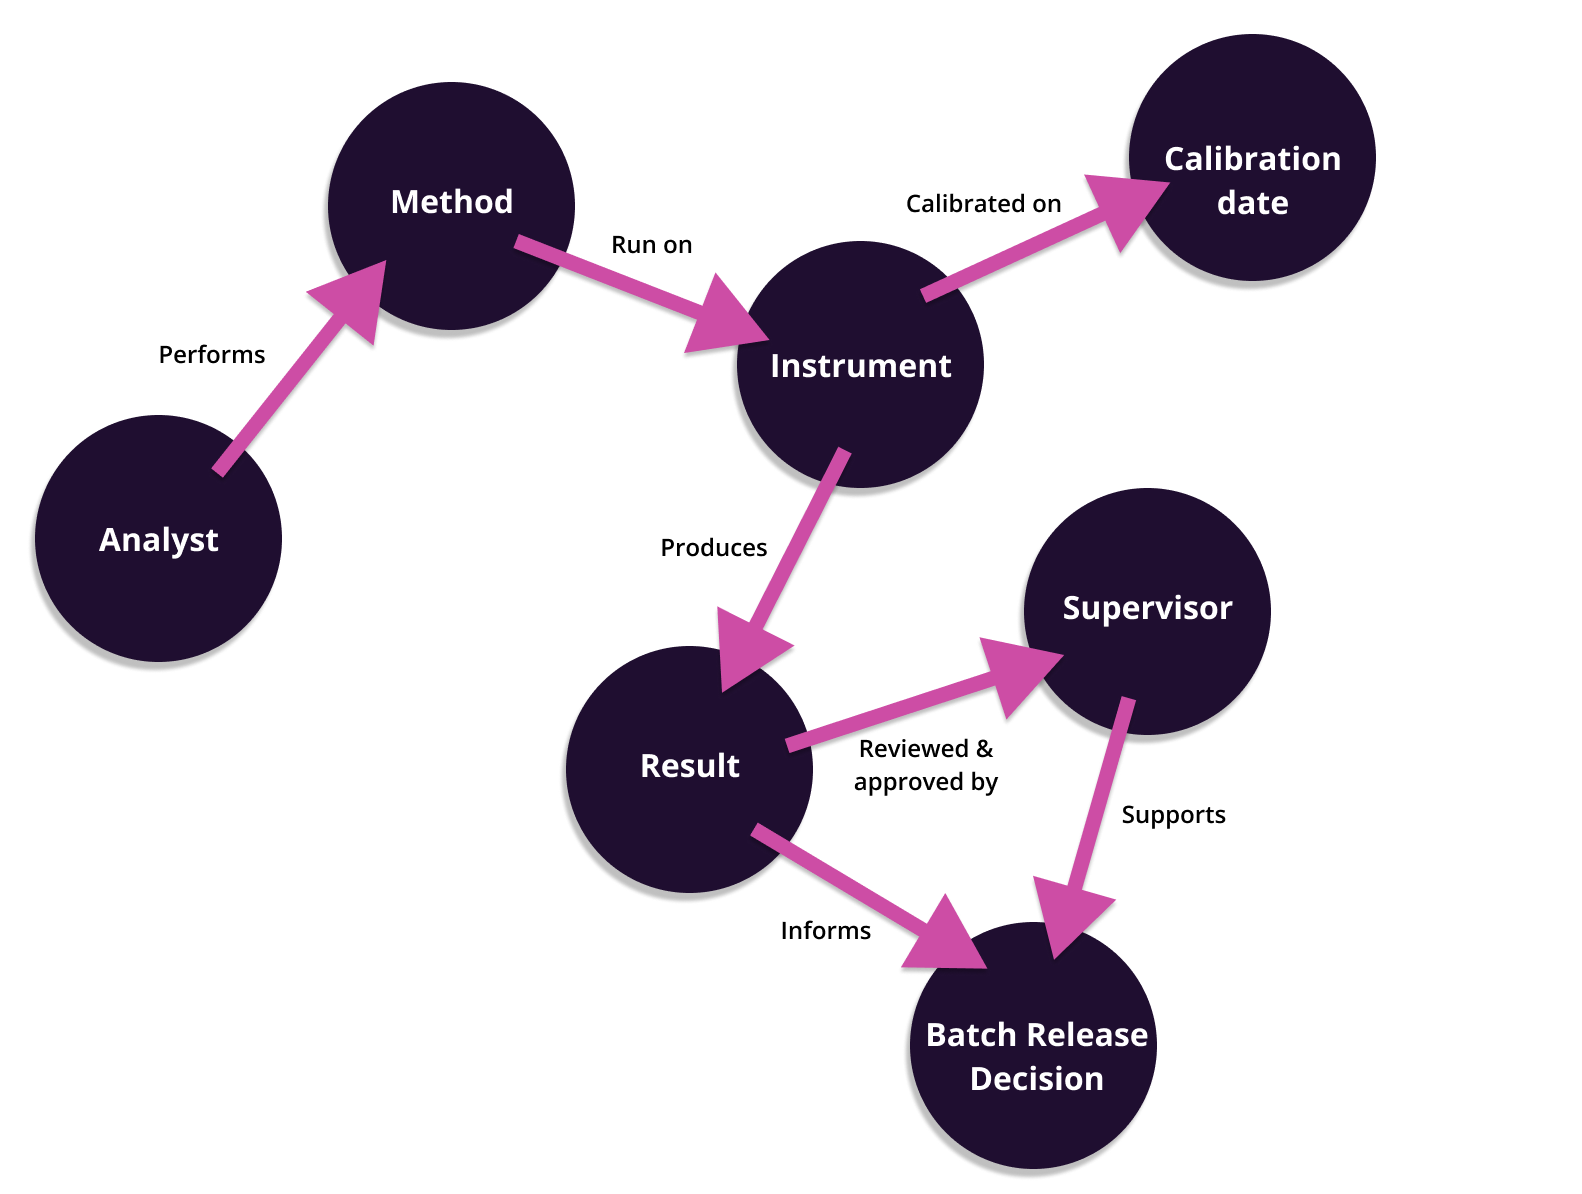
Consider a sample divided into three aliquots. One proceeds directly to an assay, another becomes part of a composite sample, and a third undergoes additional testing as part of an out-of-spec investigation. Understanding the full history means connecting the original sample, its derivatives, the testing performed, and the reasons for subsequent actions.
A graph-based LIMS can capture all of these connections as the work occurs, creating an electronic record that not only stores the data collected but also the context in which it was generated.
This gives lab teams and auditors a way to trace the full lineage of any sample. Having a clear, accessible record of this process is critical when an instrument breakdown or other exception changes the expected sequence of events.
A LIMS’s underlying data model also matters as laboratories handle more data and increasingly complex processes. Paper-based tools make it harder to track samples and materials, coordinate reviews, and document exceptions as laboratories grow. Graph architecture gives a LIMS a flexible way to incorporate new types of data and relationships, helping teams keep information connected as laboratory requirements evolve.
Flexibility doesn’t have to come at the expense of control, however, which is still critical for GMP labs. Some graph-based LIMS include visual workflows built in BPMN (Business Process Model and Notation), a standard language for designing and mapping processes. Using BPMN to configure the LIMS means that workflows are precisely defined and enforced, enabling the knowledge graph database to clearly capture data and relationships. Because workflows are modeled visually, adding a new process simply means a configuration change to a diagram rather than a code change. Additionally, every change is recorded and highlighted, supporting a risk-based approach to validation and helping teams focus validation on changes instead of the entire system.
AI makes the case for graph-based LIMS even stronger
How graph databases capture context and relationships is especially important as laboratories use AI.
To answer a question about an investigation, for example, a large language model (LLM) needs access to relevant records about the sample, method, results, and associated activities, along with context about how they connect.
A graph-based LIMS makes these relationships explicit, enabling LLMs to accurately retrieve relevant information in response to queries. For example, a user might ask which samples were tested using a particular instrument and then explore their testing histories. Because the graph connects the instrument to the samples and their testing activities, the LLM can follow those relationships to gather the information it needs to respond.
While LLMs can also retrieve information from relational databases, incomplete data relationships, missing context, and complex database structures may mean that certain queries are difficult or impossible to complete. With a graph-based LIMS, these relationships are already represented in the underlying data model, giving LLMs a clearer foundation for retrieving and interpreting information.
Evaluating graph-based LIMS for your GMP lab
For GMP labs looking to improve data traceability, support evolving workflows, and prepare for AI, graph-based LIMS offer a compelling approach. If you’re considering a graph-based LIMS, the following questions can help you assess how well it would support your GMP lab’s workflows and information needs:
- Can it connect the records that matter? Look at how samples, materials, instruments, people, methods, and results are linked, and how new types of records can be added.
- Can you trace the full history? Ask how the system tracks sample splits, testing, and subsequent activities while retaining connections to the original sample.
- How are exceptions captured? Check how instrument breakdowns, storage excursions, and investigations are documented and linked to affected samples and activities.
- How are workflows defined and enforced? Ask how processes are modeled and how the system enforces the designated steps.
- What information is captured and checked? Review how the system records necessary details at each step and checks entries for completeness and consistency.
- How will it work with existing systems? Clarify which integrations are needed and how differences in terminology and data structure will be handled.
When evaluating a solution, use a real workflow, include an exception, and ask the vendor to demonstrate how your team could follow the related records to answer a practical question.
Labbit’s LIMS is a graph-based platform, combining a knowledge graph with configurable, visual BPMN workflows to help laboratories maintain traceability, adapt to changing processes, and access data in context.


